Posts

Showing posts from February, 2008

Dynamic of Gold Stocks
Image
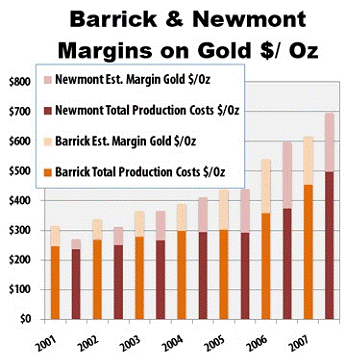
In the weekly John Mauldin's newsletter, David Galland explains why the dynamics of the Gold stocks differ from the dynamic of gold itself. According to him, now is the time to buy. Get Ready - Here Come the Gold Stocks! By David GallandCasey Research You'd have to be a monk living in isolated penury to miss the fact that gold is on a tear. Specifically, it has risen from $277.75 on January 4, 2002 to $950 last week , a gain of 242% in just over 6 years . Over the same period, the trembling S&P 500 is up an anemic 22%. In a gold bull market, an investor would expect the profits on gold stocks to be a multiple of those to be had from bullion. That leverage comes from simple arithmetic: once a gold producer covers its production costs, then each 1% rise in the price of gold can translate into a 5%, 10% or even richer improvement in the bottom line. For a company such as Barrick, with 125 million ounces in proven and probable reserves, even a $1 per ounce increase in the pric...

Oil @ $100 !!

First time ever!

S&P returns over different holdings periods

Image
Interesting chart from Prieur du Plessis about the impact of the holding period on investment returns. http://www.investmentpostcards.com/

The liquidity trap

If you think that lower interest rates would reinvigorate demand, consider this quote from Bob Campbell in the San Diego Real Estate Timing newsletter: "When an asset like real estate becomes overvalued, even if you drop interest rates to zero, you can't force consumers to borrow more, because they've already borrowed too much. Nor can you force lenders to lend, because they're already puking on 'bad paper.' It's called a liquidity trap."

Emergence of sovereign funds

Image
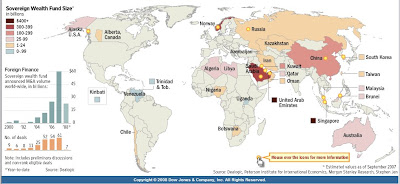
Sovereign funds have been welcomed to refinance banks who suffered (and will continue to suffer) huge write-downs from the sub-prime crisis. This map from the WSJ tells you which ones they are.

Financial meltdown

I find this worst case scenario presented by Professor Nouriel Roubini of the Stern School of Business at New York University, shockingly realistic. http://www.investorsinsight.com/otb_va_print.aspx?EditionID=651

Performance review: GOOG, MSFT vs YHOO

Image
There has been lots of buzz about the battle royale between Microsoft, Google and Yahoo. For all the jockeying, it's an interesting coincidence that all 3 are back to where they started from 12 months ago. To a buy & hold investors, nobody in this group impressed much.

From Japan’s Slump in 1990s, Lessons for U.S.

Image
I don't think the US will follow Japan's route of a very long and painful recession, but it is interesting to learn from possible parrallels. Check out the NYTimes article Japan's economic expansion after WW2 was seen as a model. In the 80s, Japan was at the centre of a real-estate boom summarized by this funny fact: "by 1989, the value world investors placed on the land on which the Imperial Palace resides was said to be equal to the value of all the real-estate in California!" as reported by Fed Chairman Greenspan in his book The Age of Turbulence . Japan banks became heavily invested in loans backed by real estate as collateral. Then came a stock-market and real-estate crash. When house prices started to plunge, the banks should have called the loans, but, for fear of losing face, the bankers restrained from doing it. It subsequently took years - 15 years of economic stagnation from 1990 to 2005 - and many governments bailouts before real estate prices stabili...

SocGen shareholders should thank Jerome Kervel

Image
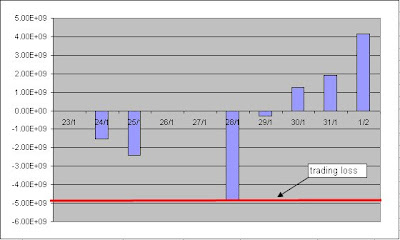
Who would have believed it? After the initial shock of losing €4.9Bn because of its rogue trader's unfortunate positions, Societe Generale has now recovered all its market value. Even better, SG's supposed weakness has prompted all of its hawkish competitors to enter in a bidding war, thus boosting its share price. Thank you Jerome! Evolution of SG's Market Value (in €Bn) following the anouncement of the €4.9Bn trading loss SocGen has overperformed its competitors since the Jan 24th announcement of the trading losses. Chart below shows the normalised evolution of the share price of SocGen vs its main competitors (SX7P= DJ STOXX Banks Index) SG's share price overperforms its peers