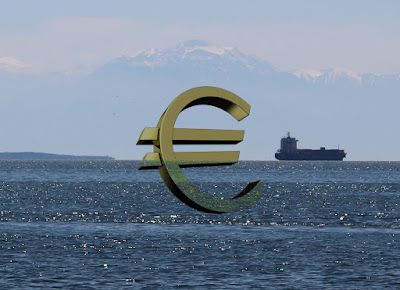
Gold reaches $1000 per ounce for the second time in 2 years.

Unfortunately, gold is a weak indicator of inflation. A
historical analysis by Erik Dellith shows that the correlation between gold and inflation is only around 0.15. The table below proves that this correlation changes with time:
Correlation Results
of Monthly Changes | Dates & Correlations |
|---|
| Period 1: | 8/76 - 6/82 | | Headline CPI [SA] | 0.17 | | Headline CPI [NSA] | 0.18 | | | Period 2: | 6/82 - 4/01 | | Headline CPI [SA] | 0.07 | | Headline CPI [NSA] | 0.03 | | | Period 3: | 4/01 - 9/06 | | Headline CPI [SA] | 0.23 | | Headline CPI [NSA] | 0.16 | |
|
SA: Seasonally Adjusted
NSA: Not Seasonally Adjusted
The author concludes that |
|
| The data suggest that the yellow metal reflects inflation -- although not very strongly -- mostly when prices are rising at a rapid pace. The relationship weakens significantly during times of moderate inflation.
|
|


Comments
Post a Comment